The first post in this series is here - it demonstrated the basic navigation in the program using the Records Window and the Property Dialog box.
There is a Tour of Family Historian 3 at http://www.family-historian.co.uk/tour/ for those interested. It includes basic navigation using the Records Window and the Interactive diagrams and Smart Trees. If you are interested in this program, then you should take this Tour.
In this post, I will show several of the charts that Family Historian 3.1 creates. The charts are created in one of two ways:
1) Using the View menu, you can choose from a list of Standard Diagrams - Ancestors, Descendants, Ancestors and Descendants, All Relatives or Everyone (in the tree). In the View menu, there is a helpful list of different standard diagrams. 2) Using the icon buttons on the row below the program menus, you can choose Ancestors, Descendants, Ancestors and Descendants, and Everyone.
Just as a test, I clicked on Everyone (all 20,700 persons in my database) and the program created a chart in about 20 seconds.
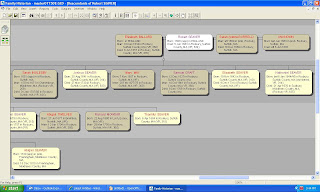
Here is a screen shot of the chart created for the Descendants of Robert Seaver (1608-1683):

It's hard to see in the Screen shot above, but for every descender to the next generation, there is a little circle. If you click on it, you can eliminate the generation below it from the chart.
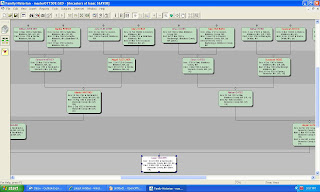
If you click on the Ancestors chart, a five generation chart appears (with Isaac Seaver (1823-1901) as the selected person, as shown below.

The little circle above each person permits you to add another generation of ancestors for that person. You can create a chart for All Ancestors from the View menu (with a choice of Ahnentafel numbers, Colourful, or No Boxes).
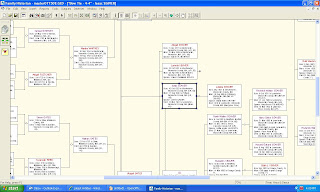
You can obtain an Ancestors and Descendants Chart (like a Bow-Tie Chart) from either the View menu or the icons below the menu row.
There are other options in the View Menu - this is a screen shot of a Bow-Tie Chart with four generations of Ancestors and four generations of Descendants:

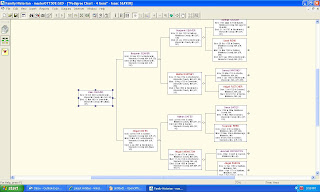
Finally, the user can create a standard Pedigree Chart for four, five or all generations from the View Menu, as shown below (4 generations):

With the requested chart on the screen, the user can click any box and the Property Dialog box for that person will open for editing.
There are buttons for Magnification (up or down), Whole Chart, Selected Area, and other ways to customize the chart.
I didn't find any way to change the font type or size, font or box color, box line weight or box size for these charts.
The Chart functions do everything that I want to do with Charts, with some flexibility to customize the chart format and the information on the chart.
No comments:
Post a Comment