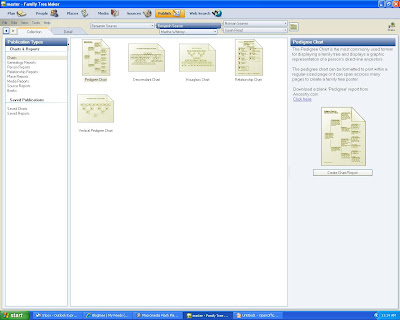
In the last post, I described and displayed the Pedigree Chart and the Descendant Chart. In this post, I want to describe the three other Charts that can be created by the program.
This is the screen shown when you click on the [Publish] icon in the top menu and have selected [Charts] in the left-hand panel:

The third chart type is the Hourglass Chart. Fore a selected person, you can create a chart that shows the ancestors and the descendants of the selected person. An hourglass chart for Benjamin Seaver (1757-1816) looks like this:
This is a "Poster" view with three generations of ancestors and three generations of descendants. I added one of the available backgrounds to this chart. The names on the chart have only the names of the people - I could add the birth, death and marriage dates and places (or any other set of facts) using the "Items to Include" icon on the right-hand panel menu (I discussed this in the last post).
The fourth chart type is the Relationship Chart. In this chart, you can select two persons in your database and see the lineage from one to the other. I chose to create a relationship chart between Benjamin Seaver (1757-1816) and myself. It came out on two portrait pages - the first one is shown below:
In this chart, the relationship of each person to the "relation from" person is listed. Only the name, birth and death dates for each person on the chart are shown. You cannot include any other fact to this chart. You cannot change the box size, the line format, or the fonts of the data inside the boxes. You can change the page format.
The fifth chart created by FTM 2008 is the Vertical Pedigree Chart. All of the options noted for the standard Pedigree Chart are available for this chart. A typical four-generation pedigree chart in vertical mode is shown below:
As with the Pedigree, Descendant and Hourglass charts, more Facts (e.g., birth, death, marriage, etc.) can be added to this chart. Formatting of the pages, including background pictures, can be added.
Each of these five Charts are very useful to a researcher. They are a significant improvement over the charts produced by earlier versions of FamilyTreeMaker.
What other charts would be useful to a researcher? I can think of some -
* a chart showing the lineage of two people from a common ancestor - for example, one showing the lineage of Randy Seaver and Barack Obama from Thomas Blossom.
* a timeline chart that shows the persons in ancestral, hourglass or pedigree relationships with major geopolitical and social events displayed.
What other charts would you like to see added to FamilyTreeMaker 2008?
Previous posts in this series:
* Using FamilyTreeMaker 2008 - Post 1: Loading. Installing the program and uploading an existing database file.
* Using FamilyTreeMaker 2008 - Post 2: Exploring. Looking around the uploaded database file to see what the different views look like.
* Using FamilyTreeMaker 2008 - Post 3: The Menus. Most of the menus were itemized and described.
* Using FamilyTreeMaker 2008 - Post 4: Starting a New Tree. I started a new tree and added some people demonstrating the program options to do this.
* Using FamilyTreeMaker 2008 - Post 5: Adding a Source. I added sources to the Facts that I previously entered.
* Using FamilyTreeMaker 2008 - Post 6: Adding Children to a Family. I added children to a family.
* Using FamilyTreeMaker 2008 - Post 7: The Person Menu. I described the items in the Person menu and attached a spouse to a person.
* Using FamilyTreeMaker 2008 - Post 8: Finding a Person in the database. I described three ways to Find a person.
* Using FamilyTreeMaker 2008 - Post 9: Places I. I explored the vagaries of the Places icon.
* Using FamilyTreeMaker 2008 - Post 10: Places II. The different map types are discussed and displayed.
* Using FamilyTreeMaker 2008 - Post 11: Places III. The method to Resolve many places with standardized place names is explored.
* Using FamilyTreeMaker 2008 - Post 12: Charts I. Introduction to Charts and examples of pedigree and descendants charts.
The next post will show some of the charts I've created using the Chart program options I selected to demonstrate the charting capabilities and to make beautiful wall charts.


No comments:
Post a Comment