In the last post, we looked at Ancestor Chart creation, and concentrated on the Chart Options menu. In this post, we will look at the other Charts created in Family Tree Builder Version 4.0.
Starting from my father as the selected person, I clicked on the "Charts" icon and the dropdown box indicated that "Ancestor Chart," "Descendant Chart," "Fan Chart," "Close Family" and "All-in-One" charts were available. For "Ancestor" and "Descendant" charts, a "Horizontal (standard)" or "Vertical" orientation can be chosen.
While in the "Ancestor Chart" type (from the last post), I upped then umber of generations to 6, and then clicked on the "Styles" button above the chart panel, and selected the "Weathered Map 2" style and saw:
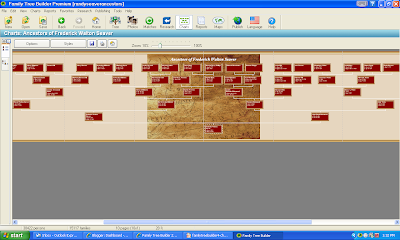
The resulting chart was 10 pages wide and 1 page high.
I went to Charts > Descendant Chart > Vertical, selected 4 generations, and saw (after I changed the Style, the fonts, and the content again):
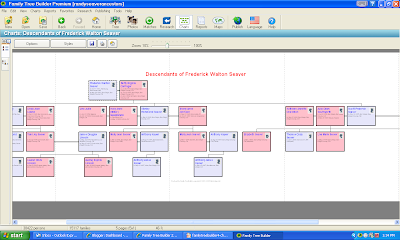
This chart was five pages wide and one page high.
The Fan Chart was selected from Charts > Fan Chart > Ancestor Chart, and I picked 8 generations:
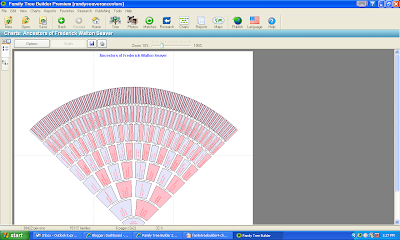
This chart was 3 pages wide and 2 pages high. The user cannot add content besides the title and the ancestor's names to this chart. Since this is probably my favorite type of wall chart, I really want to be able to add birth, marriage and death data to this chart!
The next chart is the Close Family chart - I clicked on Charts > Close Family Chart > Vertical and chose three generations:
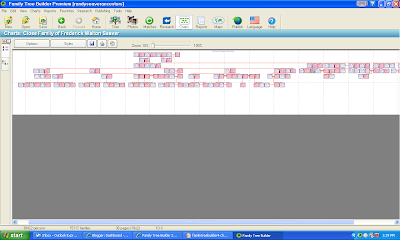
This chart is 18 pages wide and 2 pages high, and took quite a while to create (more than 5 minutes).
The last chart on the list is the All-in-One Chart. I clicked on Charts ? All-in-One Chart > Vertical and waited a really long time for it to create this chart:
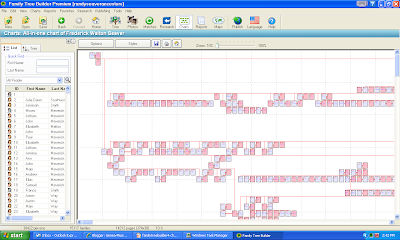
This chart has all 38,422 persons in my database. It measures 374 pages wide and 38 pages high (that's about 90 yards wide and almost 12 yards high at full scale). This chart took more than 30 minutes to generate (see, I have some patience!).
On all of these charts, the user can zoom in or out using the Zoom bar above the chart area. The smallest zoom factor is 10% up to 100%.
While these charts are all very useful, and the items to include, fonts and lines can be modified (except for the Fan Chart), there are some things that cannot be changed. Being able to change the box size would be useful. Being able to add some sort of Text Box or Photographs to the large open areas on some of the charts would be useful.
When the program is working on a large chart, there is no progress bar that shows that the program is working. On the charts that took a long time, I checked my Windows Task Manager and noted that the program was "Not Responding" and my CPU was running at 100%. Eventually, the program succeeds and creates the chart, but there is no indication that it will eventually succeed. In some cases, I have Ended the Task, and I worry that if I had made corrections or additions to my database that the work would have been lost.
We will discuss adding Photographs to the database in the next post.
No comments:
Post a Comment